command line graphing: gnuplot
Who needs charts on the command line?
If you have ever been stuck at an ssh prompt staring a bunch of data gnuplot is a must have tool. I was looking at response times over an ssh prompt and realized how I missed MS Excel. All this data would make much more sense as a chart! Apparently there are others who would agree with me and that’s the reason gnuplot exists.
Enter gnuplot
gnuplot is a command line tool that generates complex plots from data. It has a lot of options and can generate the plots as PNG, SVG etc. But most importantly it can plot your data as an ASCII chart :).
Bonus points
I use gnuplot to check my nodejs logs:
tail –lines=1000 ~/.forever/*.log | grep ‘Time: ’ | sed ’s/.* Time: l: //’ > data
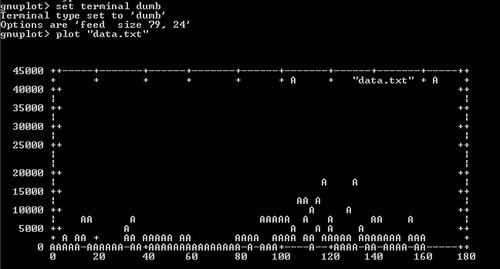
gnuplot> set terminal dumb
gnuplot> plot “data”
This is a static plot but you can even plot animated graphs like this: